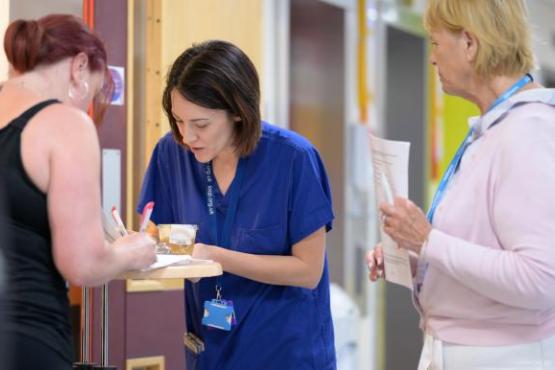
At Healthwatch Halton, we’re out in the community each and every week, listening, supporting, and sharing what we hear to help improve health and care services. 

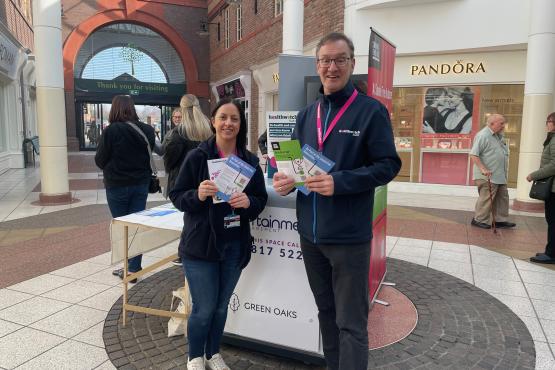
This page gives a small snapshot of our work each quarter, from the number of outreach sessions we’ve run to how many people we’ve helped through signposting and information, the time our volunteers have contributed, and more. 

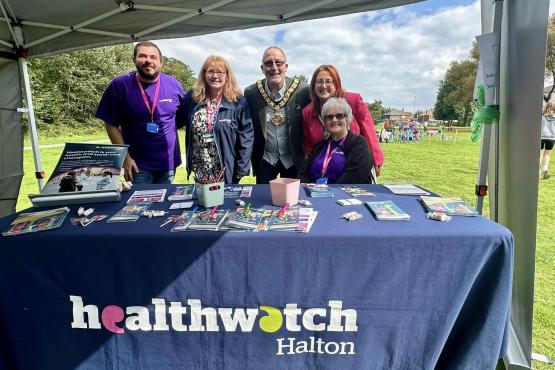
These figures show the difference we’re making—one conversation at a time.

January - March 2025

Woman sitting behind a desk in a hospital radio station.

If you'd like to find out some of the stats behind our work, just click the button below and check out the figures for Q3 2024.

Healthwatch Halton in numbers

October - December 2024

group of people standing behind a table which is covered with a Healthwatch branded tablecloth. On top of this are a number of promotional leaflets.

If you'd like to find out some of the stats behind our work, just click the button below and check out the figures for Q3 2024.

Healthwatch Halton in numbers

July - September 2024

If you'd like to find out some of the stats behind our work, just click the button below and check out the figures for Q2 2024.

Healthwatch Halton in numbers

April - June 2024

If you'd like to find out some of the stats behind our work, just click the button below and check out the figures for Q1 2024.

Healthwatch Halton in numbers